Despite strong showing out West, existing-home sales disappoint in December..
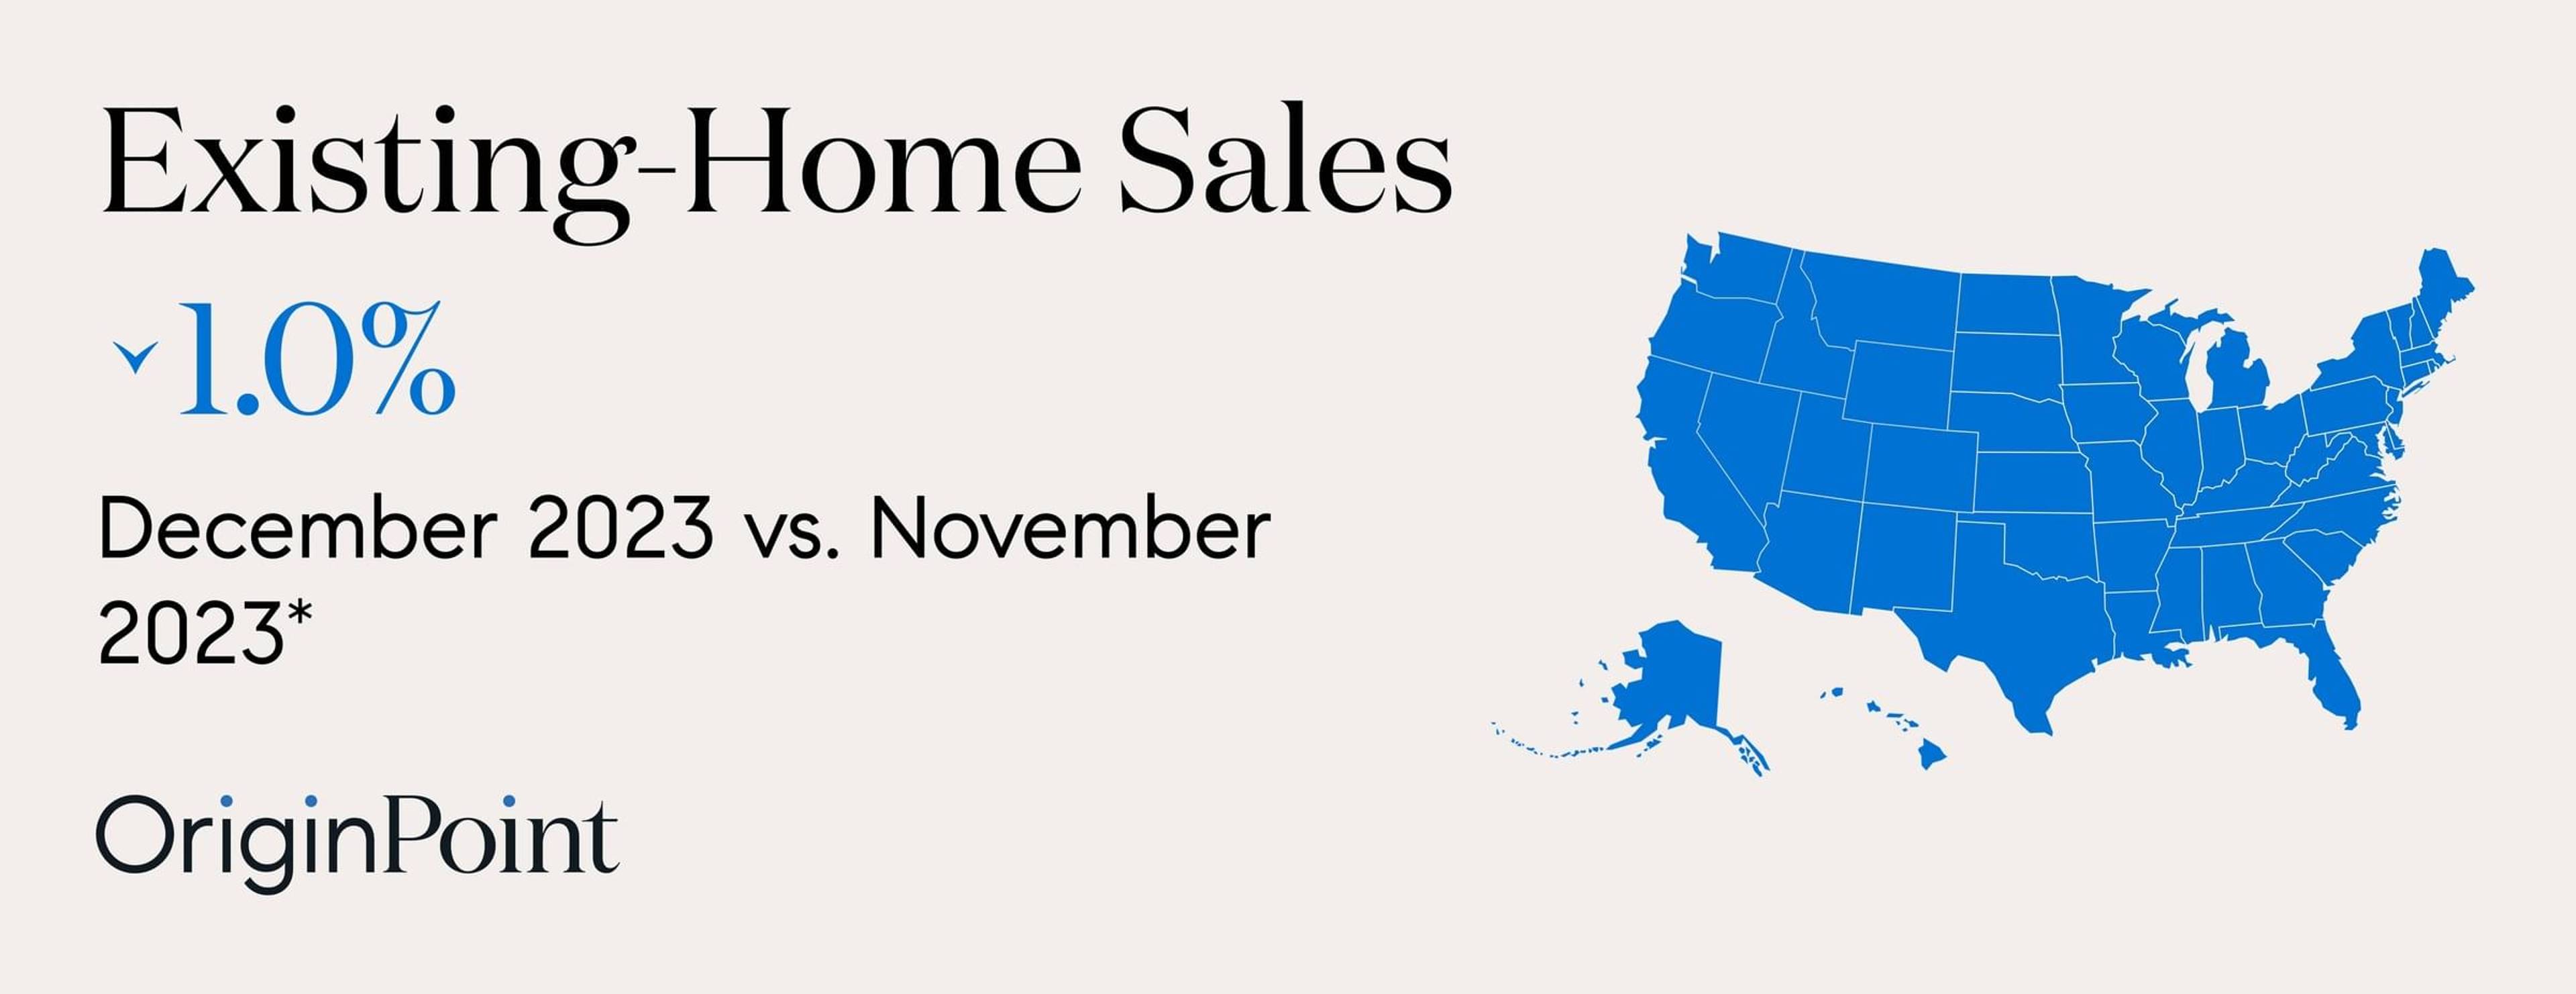
Holiday distractions may have had an effect on existing-home sales in December, despite drops in mortgage rates. After posting a positive gain in November, existing-home sales declined 1.0% in December according to the National Association of Realtors® (NAR). However, closings out West were particularly encouraging as they were up almost 8%.
"The latest month's sales look to be the bottom before inevitably turning higher in the new year," said NAR Chief Economist Lawrence Yun. "Mortgage rates are meaningfully lower compared to just two months ago, and more inventory is expected to appear on the market in upcoming months."
Trends depend on where you live
While closing activity came in sluggish in the South and Midwest, the picture was brighter in the West and Northeast. However, each region saw declines in sales from a year ago. Overall, existing-home sales in December were at a seasonally adjusted annual rate of 3.78 million, and year-over-year, sales were down 6.2% from December 2022.
Here’s how the numbers broke out by region:
- Northeast: Unchanged at 0.0%, an annual rate of 470,000, down 9.6% from December 2022
- Midwest: Down 4.3% to an annual rate of 900,000, down 10.9% from December 2022
- South: Down 2.8% to an annual rate of 1,720,000, down 4.4% from December 2022
- West: Up 7.8% with an annual rate of 690,000, down 1.4% from December 2022
First-time homebuyers were responsible for 29% of sales in December, down from 31% in November 2023 and 31% last year. All-cash sales made up 29% of transactions in December, up from 27% in November and 28% last year. Individual investors or second-home buyers were responsible for 16% of home sales, down from 18% in November and the same as a year ago.
Home prices continue to climb
The trends are so consistent from November that we can reprint the line we used a month ago: “Home prices continue to inch up year-over-year, but came down from last month during this part of the year known for a drop in homebuying interest.” The median existing-home price came in at $382,600, down from last month but up 4.4% from last year.
Month | Month-over-month | Year-over-year | Year-over-year |
|---|---|---|---|
December | $366,900 | Down 1.0% | Up 2.3% |
January | $359,000 | Down 2.2% | Up 1.3% |
February | $363,000 | Down 1.1% | Down 0.2% |
March | $375,700 | Up 3.5% | Down 0.9% |
April | $388,800 | Up 3.5% | Down 1.7% |
May | $396,100 | Up 1.9% | Down 3.1% |
June | $410,200 | Up 3.6% | Down 0.9% |
July | $406,700 | Down 0.9% | Up 1.9% |
August | $407,100 | Up 0.1% | Up 3.9% |
September | $394,300 | Down 3.1% | Up 2.8% |
October | $391,800 | Down 0.6% | Up 3.4% |
November | $387,600 | Down 1.1% | Up 4.0% |
December | $382,600 | Down 1.3% | Up 4.4% |
Total housing inventory continued its slide, down 11.5% from November but up 4.2% from one year ago (960,000). This represents a 3.2-month supply at the current sales pace, down from the 3.5-month supply last month but up from 2.9 months in December 2022.
"Despite sluggish home sales, 85 million homeowning households enjoyed further gains in housing wealth," Yun noted. "Obviously, the recent, rapid three-year rise in home prices is unsustainable. If price increases continue at the current pace, the country could accelerate into haves and have-nots. Creating a path towards homeownership for today's renters is essential. It requires economic and income growth and, most importantly, a steady buildup of home construction."
Many housing experts are predicting a good year for sales in 2024, pointing to lowering rates and positive trends in inventory. But as last month’ existing-home sales number show us, those trends can depend a lot on where you’re located. That’s why it’s important to work with a local loan officer, or get started by getting pre-approved for a mortgage in just a few minutes.
Source: https://www.nar.realtor/newsroom/existing-home-sales-slid-1-0-in-december
Your journey home begins here.
Applicant subject to credit and underwriting approval. Not all applicants will be approved for financing. Receipt of application does not represent an approval for financing or interest rate guarantee. Restrictions may apply.
All information provided in this publication is for informational and educational purposes only, and in no way is any of the content contained herein to be construed as financial, investment, or legal advice or instruction. OriginPoint LLC fka Guaranteed Rate Affinity, LLC does not guarantee the quality, accuracy, completeness or timelines of the information in this publication. While efforts are made to verify the information provided, the information should not be assumed to be error free. Some information in the publication may have been provided by third parties and has not necessarily been verified by OriginPoint LLC fka Guaranteed Rate Affinity, LLC. OriginPoint LLC fka Guaranteed Rate Affinity, LLC its affiliates and subsidiaries do not assume any liability for the information contained herein, be it direct, indirect, consequential, special, or exemplary, or other damages whatsoever and howsoever caused, arising out of or in connection with the use of this publication or in reliance on the information, including any personal or pecuniary loss, whether the action is in contract, tort (including negligence) or other tortious action.