March existing-home sales can’t maintain momentum, down 2.4% from February
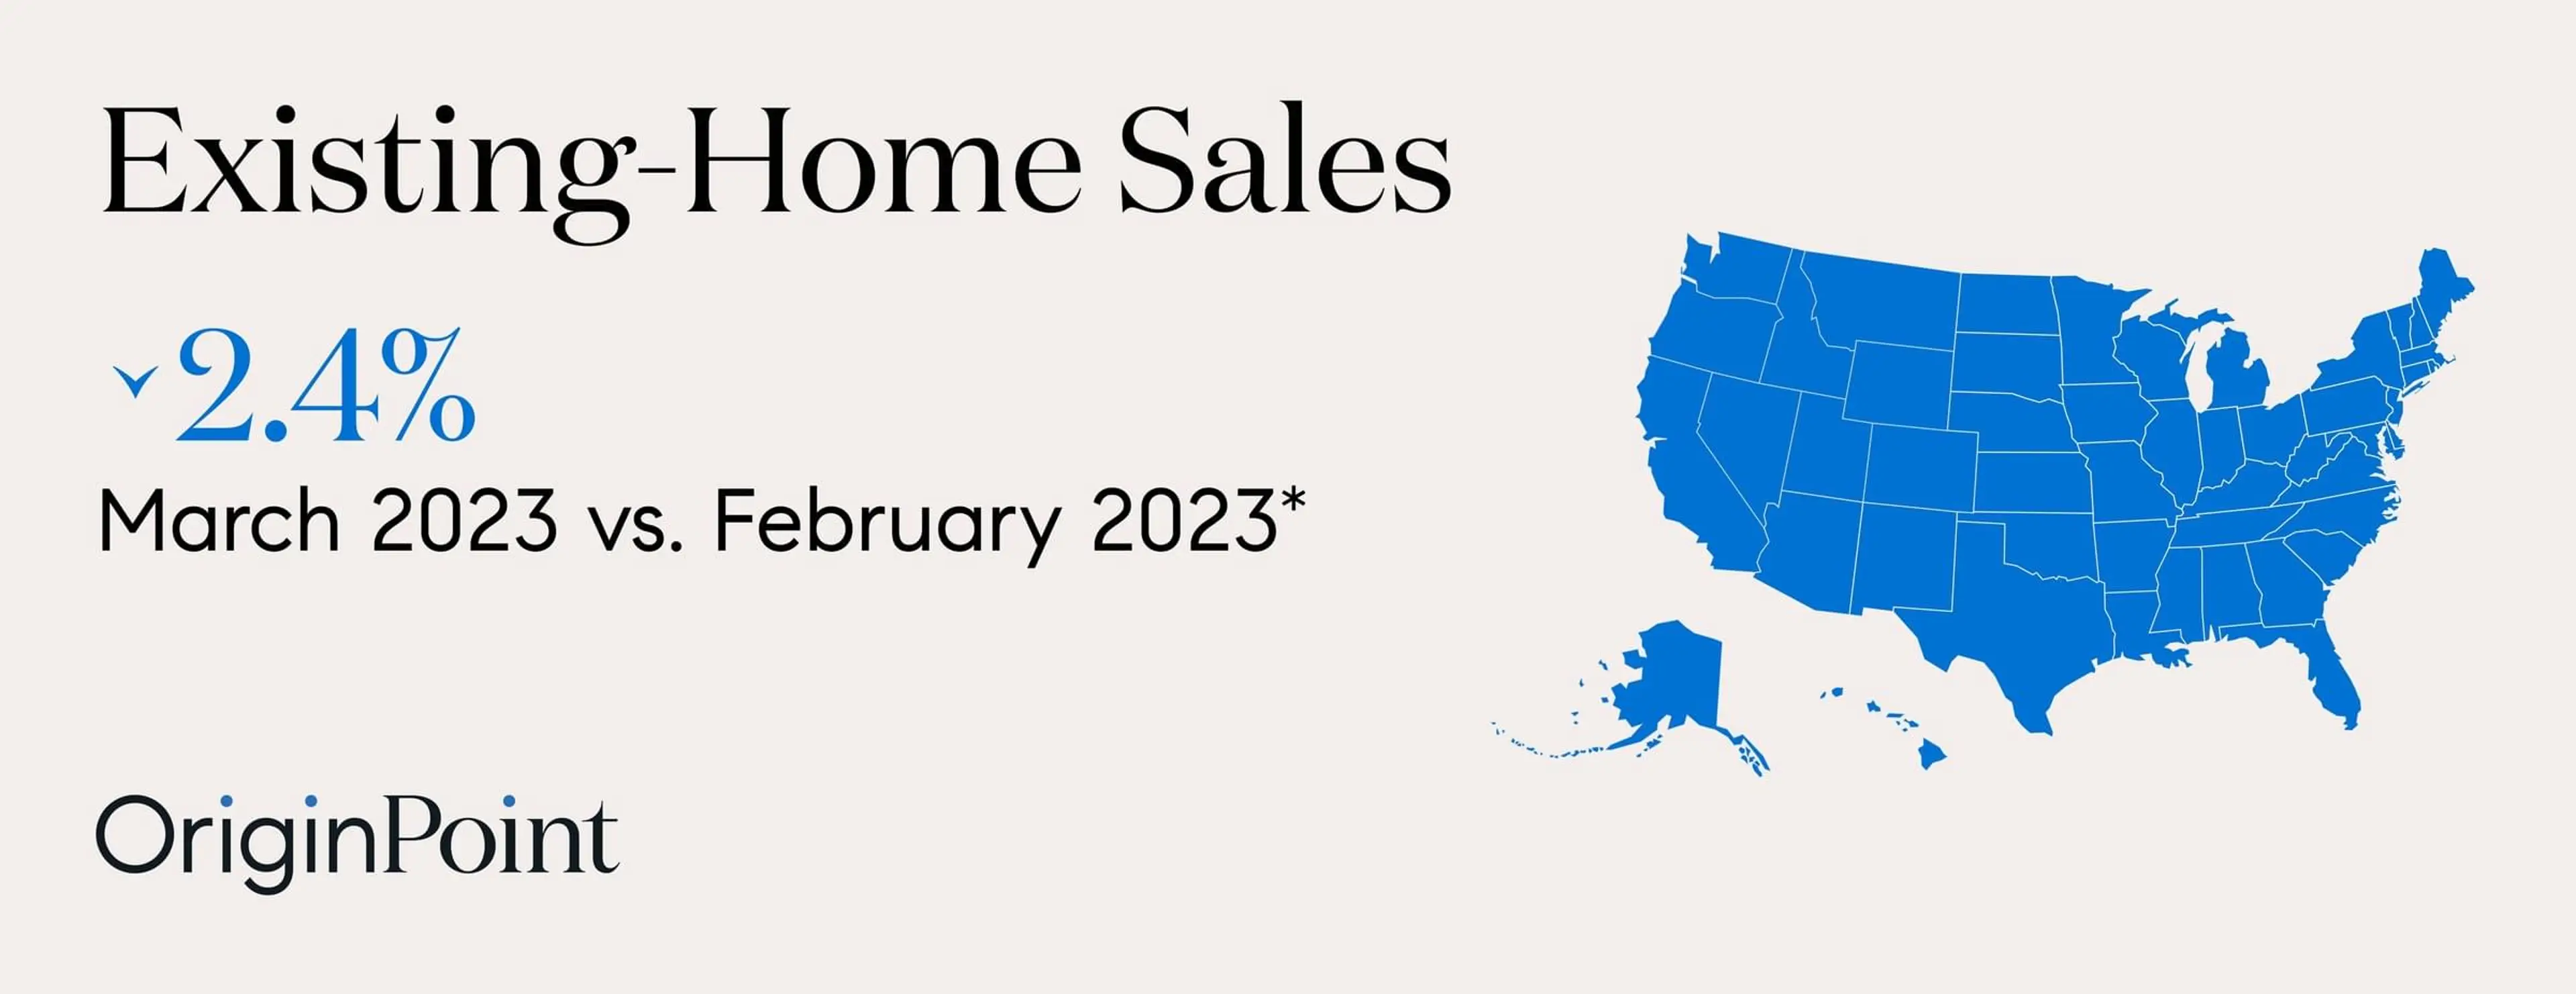
What had seemed like the beginning of a positive trend with a strong existing-home sales report from February was quickly snapped with a down report for March. The National Association of Realtors® (NAR) reported Thursday that existing-home sales retreated 2.4% in March from the previous month. Numbers were down 22.0% from March 2022.
Three of the four major regions across the U.S. saw existing-home sales decline, led by a steeper drop in the Midwest. All four regions registered a marked decline from the year before.
- Northeast: Unchanged at 0.0%, an annual rate of 520,000, down 21.2% from March 2022
- Midwest: Down 5.5% to an annual rate of 1,030,000, down 17.6% from March 2022
- South: Down 1.0% to an annual rate of 2,070,000, down 20.4% from March 2022
- West: Up 3.5% with an annual rate of 820,000, down 30.5% from March 2022
While the numbers are trending downward, mortgage rates were heading in the opposite direction during March. This could explain why February’s gains weren’t repeated.
"Home sales are trying to recover and are highly sensitive to changes in mortgage rates," said NAR Chief Economist Lawrence Yun. "Yet, at the same time, multiple offers on starter homes are quite common, implying more supply is needed to fully satisfy demand. It's a unique housing market."
A downturn or levelling off?
While it’s disappointing to see existing-home sales slide in March, it’s important to remember that February was the first increase in twelve months – and was a large increase at that. March’s number could represent more of a levelling off of home sales than a new trend. At this point, it’s too early to say.
Month | Month-over-month | Year-over-year | Seasonally Adjusted Annual Rate |
|---|---|---|---|
March | Down 2.7% | Down 4.5% | 5.77 million |
April | Down 2.4% | Down 5.9% | 5.61 million |
May | Down 3.4% | Down 8.6% | 5.41 million |
June | Down 5.4% | Down 14.2% | 5.12 million |
July | Down 5.9% | Down 20.2% | 4.81 million |
August | Down 0.4% | Down 19.9% | 4.80 million |
September | Down 1.5% | Down 23.8% | 4.71 million |
October | Down 5.9% | Down 28.4% | 4.43 million |
November | Down 7.7% | Down 35.4% | 4.09 million |
December | Down 1.5% | Down 34.0% | 4.02 million |
January | Down 0.7% | Down 36.9% | 4.00 million |
February | Up 14.5% | Down 22.6% | 4.58 million |
February | Down 2.4% | Down 22.0% | 4.44 million |
Encouraging signs for inventory, home prices
Total housing inventory increased 1% from February at 980,000 units at the end of the month. This is an increase from a year ago of 5.4%. At the current sales pace, this represents a 2.6-month supply of available homes for sale. That’s up from the 2 months’ supply we saw last March.
Last month, home prices actually went down for the first time in over a decade, and that trend continued in March. The median existing-home price in March registered at $375,700, a 0.9% decrease from a year before, though it was up from February.
Month | Month-over-month | Year-over-year | Year-over-year |
|---|---|---|---|
February | $357,300 | Up 2.0% | Up 15.0% |
March | $375,300 | Up 5.0% | Up 15.1% |
April | $391,200 | Up 4.2% | Up 10.8% |
May | $407,600 | Up 4.2% | Up 14.8% |
June | $416,000 | Up 2.1% | Up 13.4% |
July | $403,800 | Down 2.9% | Up 10.8% |
August | $389,500 | Down 3.5% | Up 7.7% |
September | $384,800 | Down 1.2% | Up 8.4% |
October | $379,100 | Down 1.5% | Up 6.6% |
November | $370,700 | Down 2.2% | Up 3.5% |
December | $366,900 | Down 1.0% | Up 2.3% |
January | $359,000 | Down 2.2% | Up 1.3% |
February | $363,000 | Down 1.1% | Down 0.2% |
March | $375,700 | Up 3.5% | Down 0.9% |
"Home prices continue to rise in regions where jobs are being added and housing is relatively affordable," Yun says. "However, the more expensive areas of the country are adjusting to lower prices."
March’s existing-home sales numbers show just how unpredictable market conditions are right now. To make sure you’re making your best decisions, work with an expert loan officer.
Source: https://www.nar.realtor/newsroom/existing-home-sales-slid-2-4-in-march
Your journey home begins here.
Applicant subject to credit and underwriting approval. Not all applicants will be approved for financing. Receipt of application does not represent an approval for financing or interest rate guarantee. Restrictions may apply.
All information provided in this publication is for informational and educational purposes only, and in no way is any of the content contained herein to be construed as financial, investment, or legal advice or instruction. OriginPoint LLC fka Guaranteed Rate Affinity, LLC does not guarantee the quality, accuracy, completeness or timelines of the information in this publication. While efforts are made to verify the information provided, the information should not be assumed to be error free. Some information in the publication may have been provided by third parties and has not necessarily been verified by OriginPoint LLC fka Guaranteed Rate Affinity, LLC. OriginPoint LLC fka Guaranteed Rate Affinity, LLC its affiliates and subsidiaries do not assume any liability for the information contained herein, be it direct, indirect, consequential, special, or exemplary, or other damages whatsoever and howsoever caused, arising out of or in connection with the use of this publication or in reliance on the information, including any personal or pecuniary loss, whether the action is in contract, tort (including negligence) or other tortious action.